

By Brian Sussman
Following two back-to-back hurricanes that severely pummeled the Southeastern United States, climate activists have swooped in like vultures, blaming political conservatives for the destruction wrought by Helene and Milton. At MSNBC, Chris Hayes spouts, “We have known for decades that our planet is warming and that we would start seeing the brutal effects. But conservatives remain so deep in their denial that they are flailing around for anyone or anything else to blame.”
While many attempt to falsely connect hurricanes to anthropogenic climate change, the truth is these monster storms are a natural and necessary function of our planet’s atmosphere. But that didn’t prevent CNN from posting a piece wildly declaring, “Helene was supercharged by ultra-warm water made up to 500 times more likely by global warming.”
Hurricane season in the Atlantic Ocean traditionally begins on June 1, as the equatorial waters warm to near-80 degrees Fahrenheit, the minimum temperature required for a hurricane to form. Water temperature is often considered the fuel for a hurricane because as the warm water evaporates it subsequently condenses within the storm releasing latent heat. However, there are a multitude of other factors that must be present for hurricane formation including a storm’s distance from the equator, light winds blowing into the center of the storm, high humidity values, and something we refer to as the “saturated adiabatic lapse rate” which is basically the rate at which saturated air cools with altitude. When all of these ingredients are in perfect sync, a hurricane begins to form.
Dr. Neil Frank, longtime head of the National Hurricane Center, contends the total number of hurricanes each year ebbs and flows in sixty-year cycles. On the average, each year there are ten tropical storms (wind speeds less than 74 mph) that develop over the Atlantic Ocean, Caribbean Sea, and Gulf of Mexico. Six of these storms become hurricanes (wind speeds of 74 mph or more). In an average three-year period, roughly five hurricanes strike the United States coastline, killing approximately 50 to 100 people anywhere from Texas to Maine. Of these, two are typically major hurricanes (winds greater than 110 mph).
The cover endorsement for my recent book, Climate Cult: Exposing and Defeating Their War on Life, Liberty and Property, was written by Dr. Frank. He contends there is no evidence suggesting we are seeing more hurricanes than ever (over the past 170 years of records), and he insists the frequency and intensity of hurricanes has not changed over years. Additionally, Dr. Frank reminds us that hurricanes are a beneficial component of the overall global atmosphere as they act as mechanisms which draw hot air from the earth’s equatorial regions into the jet stream which then transports the natural warmth to the colder latitudes. This allows for expansive and comfortable temperate zones, where most of us live.
But why do recent storms seem worse than ever?
The answer is threefold.
First, there is no doubt property damage, in terms of dollars, is on the rise. This trend is driven by the continued development of expensive property along the coasts putting more value at risk of wind and water damage. Also, flooding has increased due to residential and commercial properties edging right up to the water’s edge. Under these modern circumstances, any given hurricane would cause more damage than it would have in the past. Sadly, the same could be said for the number of lives lost during these storms.
Second is media coverage. Back when I was presenting the weather for both CBS-TV News and KPIX-TV in San Francisco, content producers knew severe weather gains eyeballs. Its still true on TV today.
Third, there is the ad nauseam, agenda-driven propaganda put forth by activists attempting to pin their climate fiction hoax on deadly hurricanes.
But why is Florida seemingly often in the crosshairs?
Because the “Sunshine State” is a sitting duck. It’s a 500-mile long, 160-mile-wide peninsula extending into the warm waters of the Atlantic and Gulf of Mexico with 1,146 miles of coastline and an average elevation of a mere 100-feet. Given that the average hurricane is about 300-miles-wide, the Florida peninsula is a prime target for potential disaster. As a result, during this 2024 season, of the nine hurricanes formed to date, four have hit the United States with two terribly striking Florida.
Brian Sussman is an award-winning meteorologist, former San Francisco radio talk host, and bestselling author.
CO2 Coalition, Gordon Fulks, Tony Heller
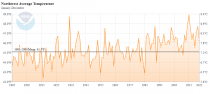
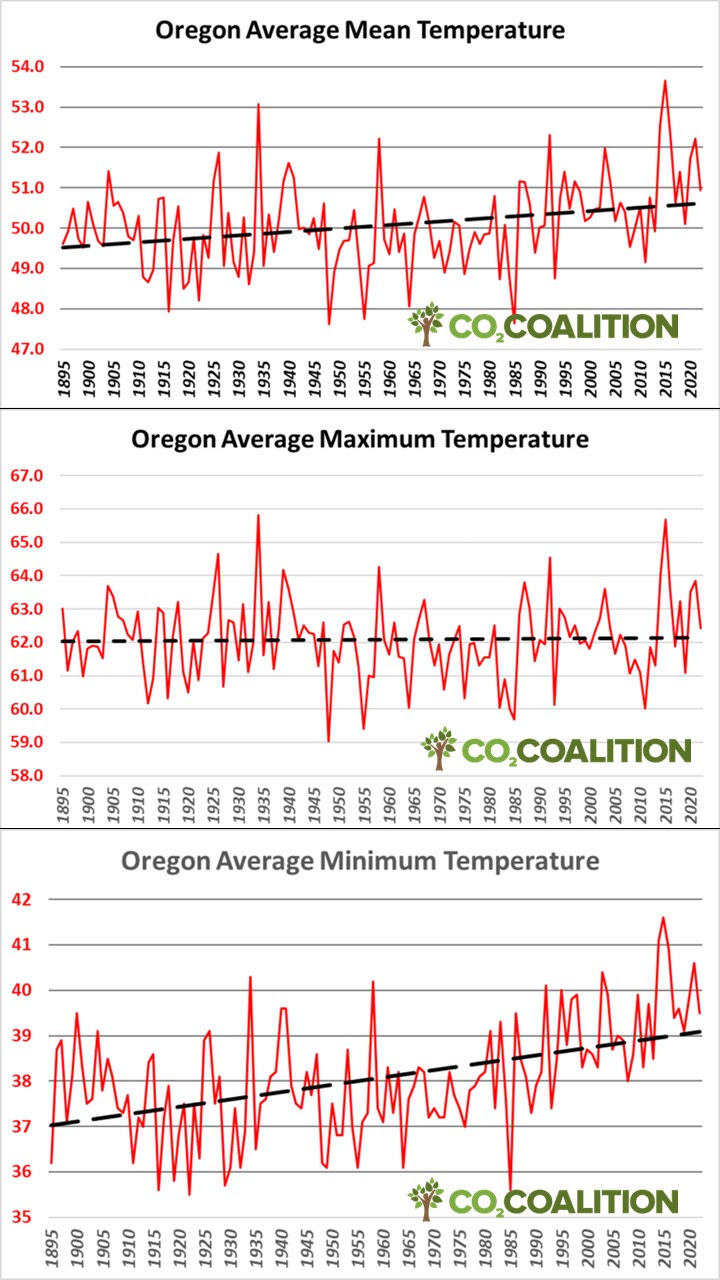
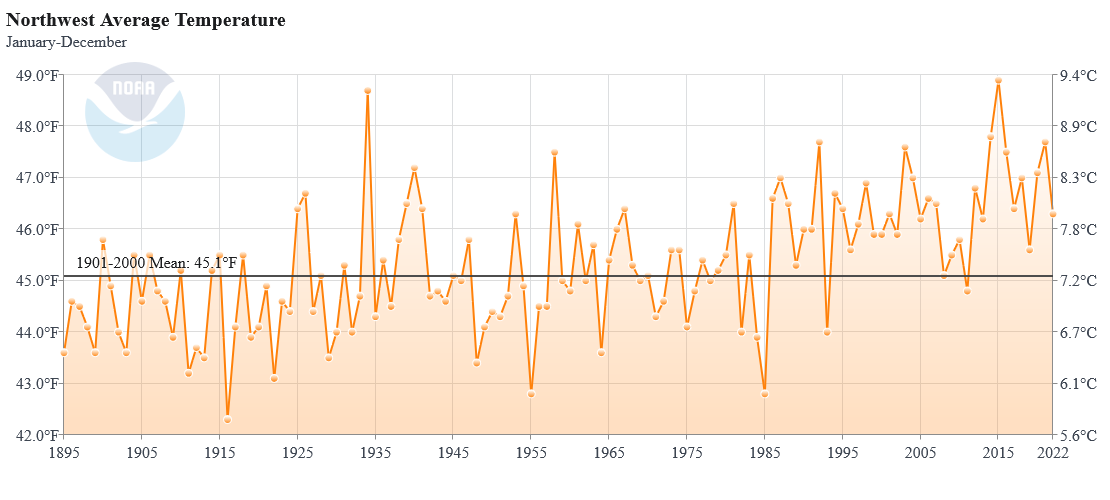
I traveled to Oregon last week at the invitation of a CO2 Coalition supporter. Besides being completely off the grid at a lodge on the scenic Rogue River, I gave a presentation to about 50 people from southern Oregon after returning from the wilderness. As you can imagine, the climate zealots are in full-on crisis mode in the Beaver State. For my talk, I examined Oregon-specific temperature data. The top image shows Annual Mean Temperature that reveals about a 1-degree Fahrenheit (F) increase since 1895 which is hardly a crisis.
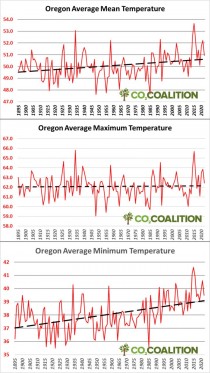
Interestingly, maximum temperatures were basically flat going back 125 years, while the low temperature readings had increased by 2.0 degrees F. Increasing night-time low temperatures benefits agriculture by extending growing seasons. Sleep well, Oregonians. There is no climate crisis.
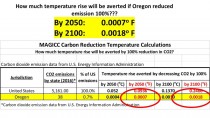
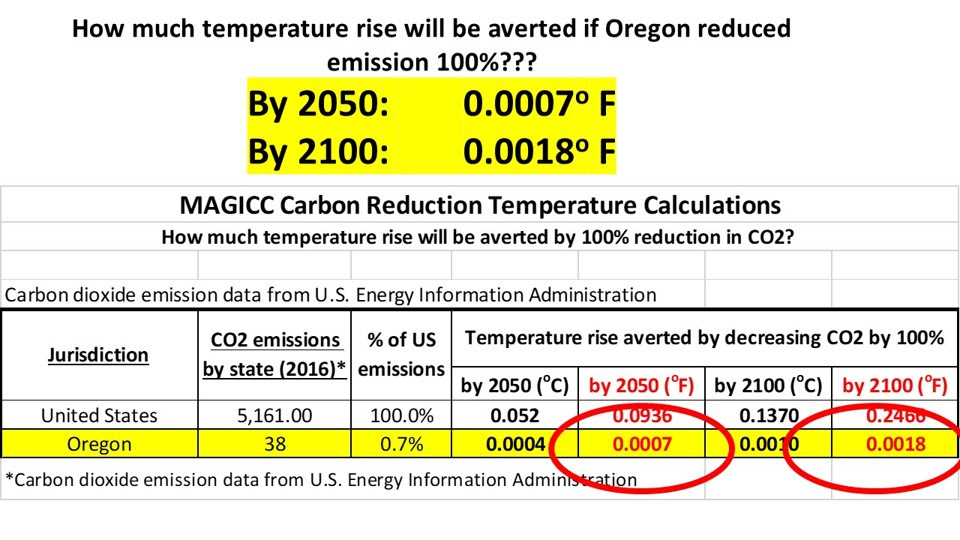
So, what will the citizens of Oregon get for going to net zero? Analysis using the MAGICC simulator indicates that, had the state attained zero emissions in 2010, the warming averted in 2050 and 2100 would be 0.0007 and 0.0018 degrees Fahrenheit, respectively. These are theoretical effects that could not be measured and would make no difference.
Oregonian scientist Dr. Gordon Fulks commented.
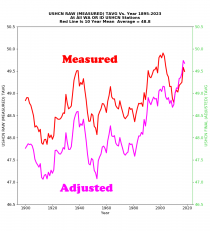
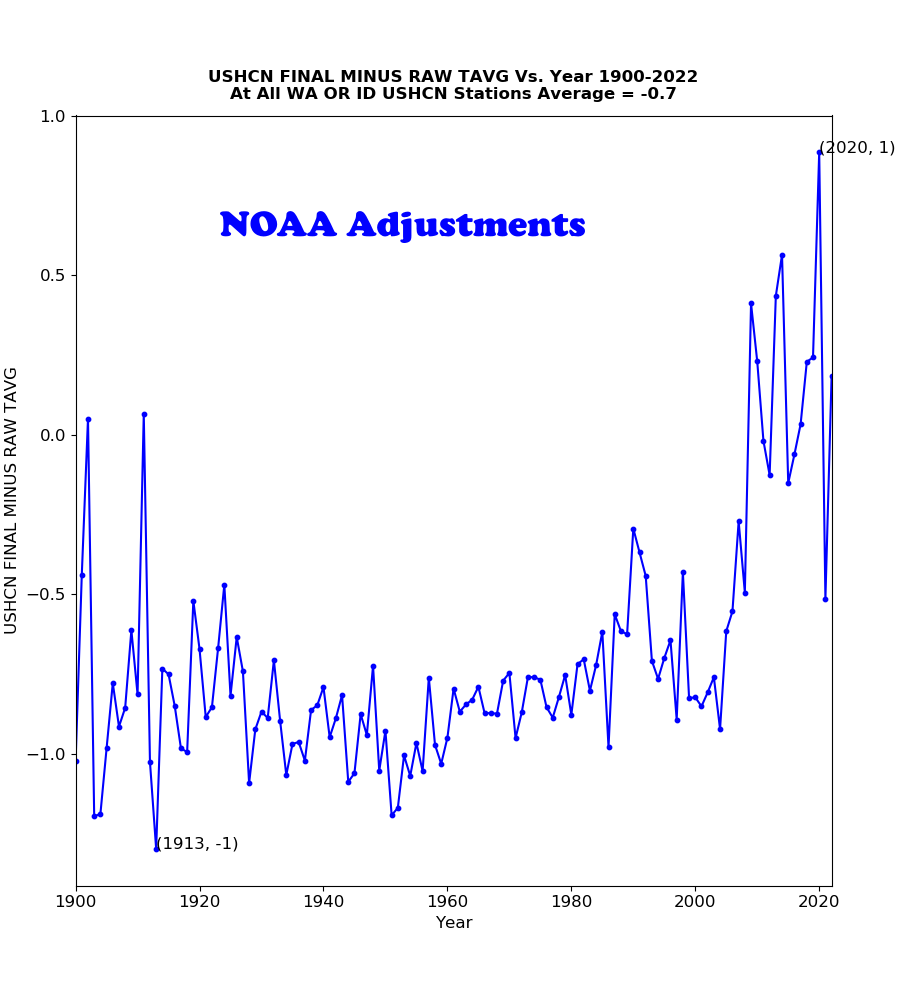
“About ten years ago, I downloaded this chart from NOAA ‘Climate at a Glance:’”
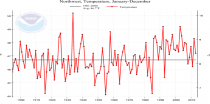
“Then a few years later I went back to get the latest version. Low and behold, NOAA had cooked the results:”
Actually, NOAA had cooled the past to create an upward trend and make the spike in 1934 slightly lower than the spike in 2015.
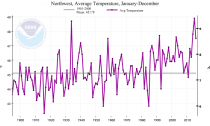
The version that I retrieved today appears to be just an updated version of the 2016 chart above, namely suspect:
-----------------
Tony Heller responds: “The reason for the change in graphs is that NOAA is now cooling Pacific Northwest temperatures prior to 2008 between 0.5 and 1.F, and warming recent temperatures by 0 to 0.5F”

The source for the two datasets can be found hereand here.
See a timetable of this and other adjustments made over time - all in the direction of the theory for political reasons here.
Dr. Patrick Frank
I’ve been studying Neftel, et al. (1988). CO₂ record in the Byrd ice core 50,000-5,000 years bp. Nature 331(6157), 609-611.
It’s a fine-grained record of dO-18 and ice core CO₂ across the Holocene transition. I digitized the CO₂ and dO-18 depth data from their Figure 4 and then used to conversion expressions in Hammer, et al., (1994) Electrical conductivity method (ECM) stratigraphic dating of the Byrd Station ice core, Antarctica. Annals of Glaciology 20,115-120 to convert meters to years.
A polynomial fit to each data set followed by taking first derivatives of the fits, allowed estimation of the timing of phase turnover for CO₂ and dO-18 presaging the Holocene.
The result is the attached figure. Air temperature (dO-18) rose about 1000 years before CO₂ began to rise.
Neftel, et al., themselves say, “The dO-18 record is shifted by 12m towards greater depth to compare the same age for both records. This assumes an age difference of 600 years between the ice and the mean age in the bubbles. The dO-18 ratio starts to increase between 200 and 1,200 years before the CO₂ concentration starts to increase. At the time the CO₂ starts to rise, the dO-18 ratio increase is already 20-30% of the total shift at the glacial/interglacial transition. According to these results the ?...” (my underline).
Neftel, et al., was published on 1 February 1988, 4 months before Jim Hansen’s 23 June 1988 testimony before Congress sparked the CO₂ frenzy.
So in June 1988, scientists in the field already knew that the only good hard data in hand disconfirmed the CO₂-temperature connection. And they pretended surprise when the later VOSTOK record appeared, confirming the Byrd result.
Did Jim Hansen know? Did he go ahead with his testimony knowing it had been empirically contradicted? That seems to be a very fair question, going to integrity.
------------
UPDATES:
Professor Valentina Zharkova said this about CO2:
CO2 is not a bad gas,” says Valentina Zharkova, a professor at the Northumbria University in Newcastle, UK. On the contrary, she points out, every garden centre uses it in its greenhouses to make plants lush and green. “We actually have a CO2 deficit in the world, and its three to four times less than the plants would like,” she notes, adding that the proportion of CO2 in the atmosphere has been at much higher levels throughout our planet’s history than it is now.
In fact, over the last 140 million years, the amount of CO2 in the atmosphere has been steadily decreasing and only now slightly starting to rise. It is currently around 420 parts per million (ppm), or 0.042%. 140 million years ago, it was estimated at 2,500 ppm (0.25%), or about six times higher. And it also meant a greener and more biodiverse world. If CO2 were to fall below 150 ppm (0.015%), it would already mean the extinction of vegetation and all other life. We came close to that during the last glacial maximum when it was at 182 ppm (0.018%).
Zharkova says that the fact that CO2 levels in the atmosphere are now increasing is a good thing. “We don’t need to remove CO2 because we would actually need more of it. It’s food for plants to produce oxygen for us. The people who say CO2 is bad are obviously not very well educated at university or wherever they studied. Only uneducated people can come up with such absurd talk that CO2 should be removed from the air,” says Zharkova.
------------
International Journal of Geosciences
Jacques Bourgois here wrote on The Sword of Damocles behind the Curtain of the Earth’s Global Warming: A Review
The “mainstream” climatology (MSC) i.e. which includes the Intergovernmental Panel on Climate Change (IPCC) community-considers the present day massive release of greenhouse gases into the atmosphere as the main cause of the current global warming trend. The main inference from this stance is that the increase in temperature must occur after the release of greenhouse gases originating from the anthropic activities. However, no scientific evidence has been provided for this basic notion. Earth paleoclimatic records document the antecedence of temperature over CO 2 levels. For the past 65 Ma, the temperature parameter has controlled the subsequent increase in CO 2. This includes the three rapid aberrant shifts and extreme climate transients at 55 Ma, 34 Ma, and 23 Ma.
The simple fact of their existence points to the potential for highly nonlinear responses in climate forcing. Whatever these shifts and transients are, CO 2 remains a second order parameter in their evolution through time. Confronted with the past, a suitable response must therefore be given to the unresolved question of whether the CO 2 trends precede the temperature trends in the current period, or not. The assertion that the current global warming is anthropogenic in origin implicitly presupposes a change of paradigm, with the consequence (the increase in CO 2 levels) that occurred in Earth’s past being positioned as the cause of the warming for its present day climatic evolution. The compulsory assumption regarding the antecedence of CO 2 levels over the temperature trends is associated with the haziness of the methodological framework-i.e. the paradigm-and tightens the research fields on the likely origins of global warming. The possible involvement of an “aberrant” natural event, hidden behind the massive release of greenhouse gases, has not been considered by the MSC.
----------
Oe of the real factors, ocean cycles
was shown by interns of Weatherbell.
The Daily Sceptic, 14 September 2022
Four leading Italian scientists have undertaken a major review of historical climate trends and concluded that declaring a ‘climate emergency’ is not supported by the data.
Reviewing data from a wide range of weather phenomena, they say a ‘climate crisis’ of the kind people are becoming alarmed about “is not evident yet”.
The scientists suggest that rather than burdening our children with anxiety about climate change, we should encourage them to think about issues like energy, food and health, and the challenges in each area, with a more “objective and constructive spirit” and not waste limited resources on “costly and ineffective solutions”.
During the course of their work, the scientists found that rainfall intensity and frequency is stationary in many parts of the world. Tropical hurricanes and cyclones show little change over the long term, and the same is true of U.S. tornadoes. Other meteorological categories including natural disasters, floods, droughts and ecosystem productivity show no “clear positive trend of extreme events”. Regarding ecosystems, the scientists note a considerable “greening” of global plant biomass in recent decades caused by higher levels of carbon dioxide in the atmosphere. Satellite data show “greening” trends over most of the planet, increasing food yields and pushing back deserts.
The four scientists are all highly qualified and include physics adjunct professor Gianluca Alimonti, agrometeorologist Luigi Mariani and physics professors Franco Prodi and Renato Angelo Ricci. The last two are signatories to the rapidly growing ‘World Climate Declaration’. This petition states that there is no climate emergency and calls for climate science to be more scientific. It also calls for liberation from the “naive belief in immature climate models”. In future, it says, “climate research must give significantly more emphasis to empirical science”.
‘Extreme’ weather events attributed by climate models - somehow - to anthropogenic global warming are now the main staple of the climate alarmist industry. As the Daily Sceptic reported on Monday, Sir David Attenborough used a U.K. Met Office model forecast in the first episode of Frozen Planet II to claim that summer Arctic sea ice could be gone within 12 years. But the likelihood of hardy swimming galas over the North Pole by 2035 seems somewhat remote, not least because Arctic sea ice has been growing in many summers since 2012. According to a recent report from the U.S.-based National Snow and Ice Data Center, at the end of August “sea ice extent is likely to remain higher than in recent years”.
Hurricane and cyclones are favorite subjects for green alarmists. It is unsurprising why they focus on these storms, since the Italian scientists note that historically around 60% of all economic damage caused by global disasters is the consequence of U.S. hurricanes. On May 27th, the Met Office predicted that the 2022 Atlantic hurricane season, which runs from June to November, would “most likely” be above average, with a “likelihood” of 18 named tropical storms including nine hurricanes and four major hurricanes. In fact, the current Atlantic hurricane season has had its slowest start for 30 years. At the end of August there have been no hurricanes, and only three named storms, none of which produced winds of 74mph or higher.
There is plenty of evidence that hurricane and cyclone frequency and intensity has changed little over the recent historical record. “To date, global observations do not show any significant trends in both the number and the energy accumulated by hurricanes,” note the Italian scientists. The two graphs below demonstrate this.
The IPCC has reported that hurricanes have increased in frequency in the North Atlantic since 1878, but the scientists note that observations were relatively low during the first decades of the 20th century. After adjusting for lack of observational capacities in the past, there is a nominal upward trend. This trend, they explain, “is not significantly distinguishable from zero”.
The scientists accept that there has been a recent increase in heatwaves, which they attribute to the 1C rise in global temperatures, although they note global heatwave intensity trends “are not significant”. They also point out that only a limited number of weather stations have observed an increase in global rainfall.
Corresponding evidence for increases in flooding remains elusive, they say, “and a long list of studies shows little or no evidence of increased flood magnitudes, with some studies finding more evidence of decreases than increases”. So far as drought is concerned, the scientists note the AR5 finding of the IPCC that “conclusions regarding global drought trends increasing since the 1970s are no longer supported”. Several studies are said to show no increase in the main indices regarding global droughts.
In fact, a slightly warmer and wetter planet and a little extra CO2 seem to have done wonders for global crop yields. For the period 1961-2019, maize, rice, soybean and wheat global average yields are reported to have grown every year by 3.3%, 2.4%, 2.6% and 3.8% respectively.
Well-researched, fact-driven, credible scientific papers such as this are crucial in the battle to stop green activists and rentiers having a free run to catastrophise every bad weather event in the interest of promoting a command-and-control Net Zero agenda. Attempting to attribute single weather events to humans burning fossil fuels is the product of feverish imaginations and ‘garbage in, garbage out’ climate models. Rational, evidence-based science should be promoted at every opportunity.
By David Wojick
The beginning: “The new and so-called Next Generation Science Standards are now law for about a third of American children. They say what will be taught in each grade from first grade through high school. At least 20 states have adopted them. See
Traditional standards still govern in the other States. These generally mandate that climate science will be taught in high school Earth Science courses. Earth Science is an optional course, not a requirement, and even then climate is a minor topic.
In stark contrast the Next Gen standards are alarmist to the core. They mandate that climate be taught in middle school science, which everyone takes. The topic is emphasized, with alarmism a central feature. This means lots of climate modeling, even though these students have had relatively little prior science. They cannot possibly evaluate the models they are forced to use.
Implementing Next Gen requires developing lesson plans that say what will be taught in each one hour class, often including how it will be taught. Writing these lesson plans for every topic, in every grade, is a huge ongoing effort.
Next Gen has just approved a big climate science unit and it is very bad. It starts with newspaper accounts of floods and droughts, blames them on our CO2 and methane emissions, then ends with community action. And this is for 7th graders, who are typically around 13 years old and know very little hard science. This is pure alarmism presented to children as science. It is purely shameful.
The developer is OpenSciEd, where open means their products are free for schools to use. Who pays is an interesting question. The title is “OpenSciEd Unit 7.6: How Do Changes in Earth’s System Impact Our Communities and What Can We Do About It?” Get it? Changes cause impact requiring community action. The standard alarmist formula, action not science.
You can find the junk here.
They even have a neat trick in their advertising. They claim the students “figure out” all this alarmism, saying this: “This unit on Earth’s resources and human impact begins with students observing news stories and headlines of drought and flood events across the United States. Students figure out that these drought and flood events are not normal and that both kinds of events seem to be related to rising temperatures.”
Also:
“Students figure out that the rising temperatures are caused by an imbalance in Earth’s carbon system, resulting in a variety of problems in different communities. The unit ends with students evaluating different kinds of solutions to these problems and how they are implemented in communities.”
A lot of student figuring, right? They must think a lot. Wrong! This is pure indoctrination!
There is more in the article including a revealing lesson list. Please share it.
We need a campaign to block the adoption of these horrific lessons
Note that I have a Climate Change Debate Education site with lots of skeptical materials, including links to about 350 videos by leading skeptics.
I also have a fundraiser for this education effort here.
We have been relatively inactive but are now gearing up to fight this indoctrination. Donations are most welcome. You can donate anonymously.
David
By David Wojick |April 8th, 2022
A foolish end to a foolish target - limiting global warming to 1.5 degrees C. That is the warming from 150 years ago, just 0.5 degrees or less from today forward. Of course this is all according to the worthless computer models, but let’s go with the flow.
The massive new IPCC report makes it clear. You can’t get there from here (not that we wanted to). Not by any even reasonably possible means, so the target will be missed (according to the models). What will the alarmists do without their beloved target?
It is all about something called the “carbon budget”. Unlike the climate, and the climate models for that matter, the carbon budget is very simple. It is how much CO2 the human race is allowed to emit in order to stay below the target warming.
Not how much this year, or this decade, or even this century. This is the limit forever. So enjoy it while you can because time is very short, or so says the IPCC report. In fact time is up, over and past.
First, here is the budget: The IPCC says “...the current central estimate of the remaining carbon budget from 2020 onwards for limiting warming to 1.5C with a probability of 50% has been assessed as 500 Gt CO2...”
500 Gigatons is a suspiciously round number but never mind. Just how big is it? The IPCC explains it nicely: “....cumulative net CO2 emissions between 2010-2019 compare to about four fifths of the size of the remaining carbon budget from 2020 onwards for a 50% probability of limiting global warming to 1.5C...”
So our forever budget, starting in 2020, is just a bit bigger than our emissions in the last decade! That is it, for all eternity. Note that even then we are just buying a 50% chance of staying under the dread 1.5 degree target. Not a good way to bet the global economy.
But our emissions are not going down, in fact they are still going up. Nor can they possibly come down enough to make any difference. We do not have time to open all the mines and build all the factories (after getting all the permits!) then make, install and operate all the stuff we would need to meet that budget (after getting all the permits). In fact building all this stuff might well double our emissions for the next ten years. Oh wait, we have less than 8 years.
The conclusion is obvious. We are going to burn the carbon budget and keep on emitting many hundreds of gigatons of CO2 after that. There is no feasible way not to.
So how are the alarmists going to handle this failure? They have foolishly hyped their way into a corner.
The standard way the 1.5 degree target is explained in the green media is “to avoid the worst effects of climate change” but that has always been nonsense. The worst effects would occur at 6 degrees or more, not as we pass 1.5 degrees.
There is nothing in the science about a 1.5 degree threshold. No tipping point, no catastrophe, no emergency. Nothing at all, so it is a made up number. The models get a little bit worse with every temperature increase, but just a tiny bit and passing 1.5 degrees is no different than passing any other level. When it comes to being the threshold to catastrophe, there is no there there.
In this very real sense the reported 1.5 degree threshold to catastrophe is a hoax. Except the people pushing it do not know that, so it is more of a colossal blunder. Except the IPCC does know it and has never corrected the activists and governments that are calling the meeting of this harmless target an emergency. This makes it a hoax by omission.
I have no idea what the alarmists will do as they finally admit that the 1.5 degree target cannot be met. But it should be fun to watch.
David Wojick, Ph.D. is an independent analyst working at the intersection of science, technology and policy. For origins see here For over 100 prior articles for CFACT see here Available for confidential research and consulting.
Claim: 23 Million Year Old Fossilized Leaves Offer Proof of CO2 to Greening the Planet link
Anthony Watts
From the we told you so department.
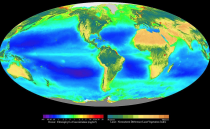
Composite image showing the global distribution of photosynthesis, including both oceanic phytoplankton and terrestrial vegetation. Dark red and blue-green indicate regions of high photosynthetic activity in the ocean and on land, respectively. Image: NASA SEAWIFS
The links between rising carbon dioxide levels, and greening trends have been supposedly confirmed by fossilized leaves from a 23 million-year-old forest.
Researchers previously postulated that ancient increases in atmospheric CO2 during the early Miocene allowed plants to perform photosynthesis more efficiently. But the latest research, published last Thursday in the journal Climate of the Past, is said to confirm the link between CO2 and greening in the fossil record.
This is something NASA satellites have already observed in the modern-day era. Recent satellite surveys suggest rising CO2 levels are responsible for greening patterns across the planet, including Arctic and drylands ecosystems.
The latest research suggests that greening trends are likely to continue as CO2 levels approach those recorded during ancient period of warming.
According to the new study, increases in photosynthesis rates won’t be able to keep up with current rates of human-caused carbon emissions. In addition, previous studies suggest increases in rates of photosynthesis can prevent staple crops from absorbing calcium, iron, zinc and other minerals important for human health.
By comparing the fossilized leaf structures, including microscopic veins, stomata and pores, to those of modern leaves, researchers designed a model to more accurately predict CO2 levels.
“It all fits together, it all makes sense,” said study co-author William D’Andrea, a paleoclimate scientist at Lamont-Doherty. “This should give us more confidence about how temperatures will change with CO2 levels.”
Well, it may :"all fit together’ but the plants sure seem happy as of late.
------------
NASA: Higher CO2 levels responsible for ‘greening’ Earth
By Brooks Hays
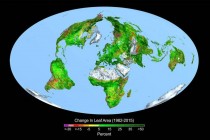
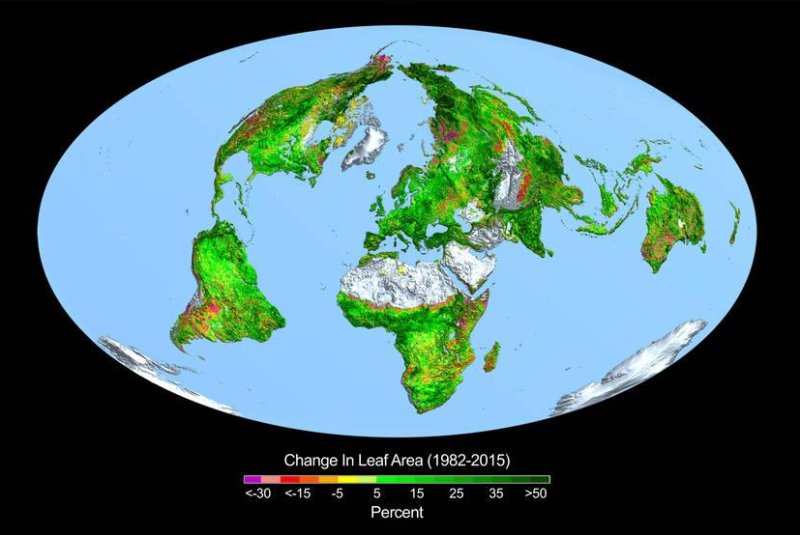
A map of the world visualizes the change in leaf area, or greening, over the past 30 years. Photo by Boston University/R. Myneni
Enlarge Photo
WASHINGTON, April 26 (UPI)—New research confirms rising CO2 levels are driving the “greening” Earth effect observed by satellites.
Greening is evidence of accelerated plant growth and heightened rates of photosynthesis. Carbon dioxide is a main source of fuel for plants—and thus, all life on Earth—and previous studies show a rise in CO2 results in plant growth.
But other sources of nutrients and external factors can accelerate photosynthesis and greening, including changes in nitrogen levels, land usage, temperature and weather.
An international team of researchers isolated each of these factors and ran them through a series of computer models. The results suggest rising CO2 levels best explain the increase in leaf cover, or greening, measured by NASA and NOAA satellites.
Depending on weather-dependent energy for jobs and living standards takes money, resources
David Wojick
Power system design can be extremely complex, but one simple number is painfully obvious. At least it’s painful (and terribly inconvenient) to advocates of wind and solar power - which may be why we never hear about it, why it too often gets deliberately hidden from view. It is a big, bad number.
To my knowledge, this big number has no name, but it should. Let’s call it the “minimum backup requirement” for wind and solar, or MBR. The minimum backup requirement is how much generating capacity a system must have if it is to reliably produce the electricity we need when wind and solar don’t.
For most places, the magnitude of MBR is very simple. It is all the juice needed on the hottest or coldest low wind nights. It is night, so there is no solar. Sustained wind is less than eight miles per hour, so there is no wind power. It is very hot or very cold, so the need for power is very high.
In many places, MBR will be close to the maximum power the system ever needs, because heat waves and cold spells are often low wind events, as well. Both heat and cold are often caused by large high pressure systems that have very little wind in them.
During heat waves, it may be a bit hotter during the day but not that much. During cold spells, it is often coldest at night, when people need power the most, so they don’t freeze to death in the dark. Think Texas.
Thus what is called “peak demand” is a good approximation for the maximum backup requirement. In other words, there has to be enough reliable generating capacity to provide all the maximum power the system will ever need. For any public power system, that is a very big number; as big as it gets, in fact.
Actually, it’s even a bit bigger, because there also has to be margin of safety, or what is called “reserve capacity.” This is to account for something not working as and when it should. Fifteen percent is a typical reserve in American systems. This makes MBR something like 115% of peak demand.
We’re often told wind and solar are cheaper than coal, gas and nuclear power. But that does not include the MBR for wind and solar. What is relatively cheap for wind and solar is the cost to produce a unit of electricity under optimal conditions. This is often called LCOE or the “levelized cost of energy.”
What we really need to be talking about has to reflect the need to add reliable backup energy to give people the power they need, when they need it. This total cost makes wind and solar very expensive.
In short, the true cost of wind and solar is LCOE + MBR. This is the huge cost you never hear about. But if every state goes to wind and solar, then each one will need to have MBR for roughly its entire peak demand. That is an enormous amount of generating capacity.
It means more than doubling the normally needed generating capacity… the raw materials to build that dual capacity ...and the real costs of having insufficient, widely dispersed, land-intensive, weather dependent, unreliable wind and solar, plus that minimum backup requirement. Simply put, it takes big energy to back up what is often too little wind and solar power.
Of course, the cost of MBR depends on the generating technology. Battery storage is out, because the cost is astronomical for the billions of half-ton battery modules that would be needed to store enough power for a city, state, region or country during multiple days of low wind and low sun.
Gas fired generation might be best, but it is fossil fueled, as is coal. If one insists on zero fossil fuel, then nuclear is probably the only option. Operating nuclear plants as intermittent backup is stupid and expensive, but so is no fossil fuel generation - or no electricity generation. And getting new nuclear plants built almost anywhere on Planet Earth is all but impossible in today’s political climate.
What is clearly ruled out is 100% renewables, because there would frequently be no electricity at all. That is unless geothermal could be made to work on an enormous scale, which would take many decades to develop. (And many of the best traditional geothermal sites are in or near national parks, and other scenic or natural areas, like Yellowstone, making environmentalist opposition a foregone conclusion.)
It is clear that the Biden Administration’s goal of zero fossil fuel electricity by 2035 (without nuclear) is economically impossible because of the minimum backup requirements for wind and solar. You can’t get there from here.
We shouldn’t have to wonder why we almost never hear about this obviously enormous cost for wind and solar. Bringing it into the open would seriously undermine the case for “affordable, clean, green, renewable, sustainable” energy. So the utility companies I’ve looked at avoid it with a clever trick.
Dominion Energy, which supplies most of Virginia’s juice, is a good example. The Virginia Legislature passed a law (the 2020 Virginia Clean Energy Act) saying Dominion’s power generation had to be zero fossil-fueled by 2045. Dominion developed a Plan explaining how they would supposedly do this.
Tucked away in passing on page 119, the company says it will expand its capacity for importing power purchased from other utilities. This increase happens to be to an amount equal to their peak demand.
The plan is to buy all the MBR juice from the neighbors! But if everyone is going wind and solar, no one will have juice to sell. In fact they will all be trying to buy power - which cannot possibly work.
Don’t forget, the high pressure systems that cause low wind can be huge, covering a dozen or more states. They can last for days. For that matter, no one has that kind of excess generating capacity today, when we still have abundant coal, gas and nuclear power for primary electricity generation and backup.
Most utilities are barely covering their own needs as it is. Once every utility, in every state, is required to go 100% zero fossil fuel, it will be a guaranteed debacle, over and over.
Big cities like New York won’t be able to buy their way out of repeated blackouts.
To summarize, for every utility there will be times when there is zero wind and solar power, combined with near peak demand. Meeting this huge need is the minimum backup requirement. The huge cost of meeting this requirement is part of the cost of wind and solar power - the part nobody wants to talk about, especially politicians, environmentalists and utilities. MBR makes wind and solar extremely expensive.
The simple question to ask the Biden Administration, the states and their power utilities is this: How will you provide power on hot or cold low-wind nights?
When you ask that question, stay by the microphone, so that you can demand more than the doubletalk, phony assurances and outright lies you will assuredly get when they first respond to this vitally important, inconvenient, anti-woke question.
David Wojick is an independent analyst specializing in science, logic and human rights in public policy, and author of numerous articles on these topics.